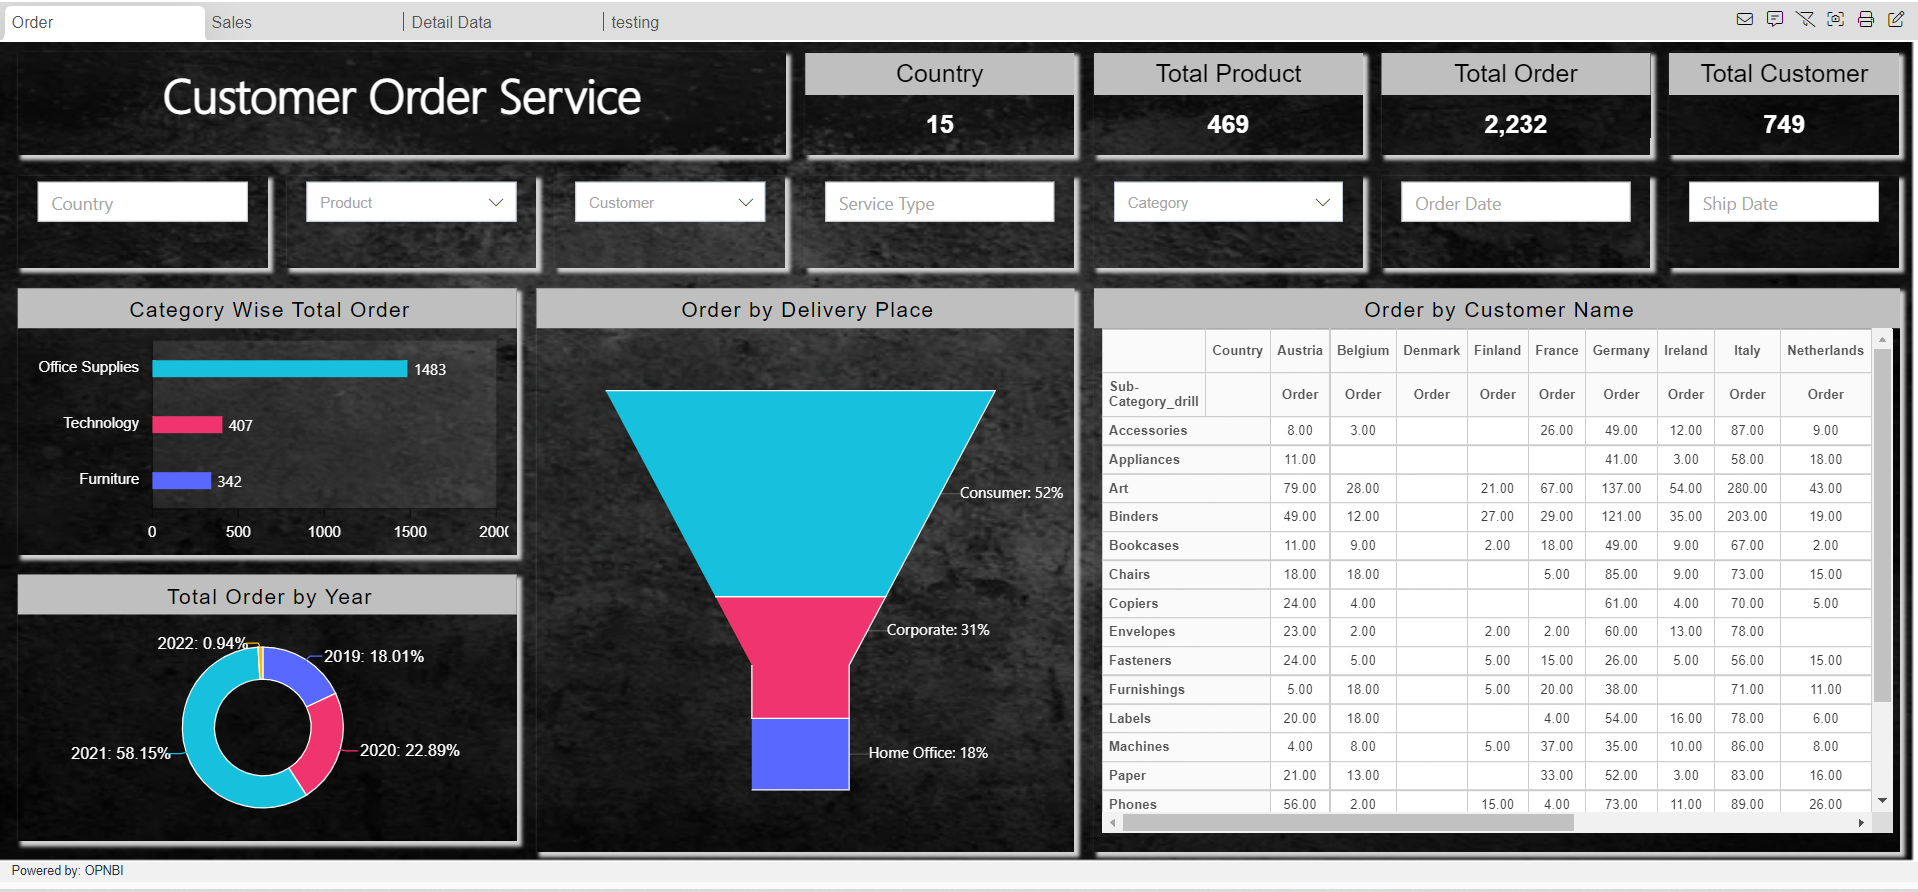
Customer Order Service
Introduction
A delivery order includes the complete details of delivery like When the Order is placed for an item delivered, the delivery order outlines who it will be shipped to, how it will be shipped, special needs for the delivery, and when to release the delivery. This information is important because delivery is one of the most important aspects of the sales process.
Prerequisites:
Download the “Customer Order Service.zip” file from Marketplace you should get the following folder structure.
• dashboards
• datasets
• datasources
• reports
• images
• resources
Order Tab:
Download Customer Order Service Code.zip file from here
Customer Order Service Title:

From the right vertical menu of the dashboard select the Custom Visualization Widget and update the Properties, as below:
In HTML Properties enter the HTML code Provided in the HTML Folder >> Customer Order Service Title file.
In CSS Properties enter the CSS code Provided in the CSS Folder >> Customer Order Service Title file.
Go to the Widget Setting and enter the following details in Widget Box Shadow Properties:
Box Shadow: Enable

Box Shadow Horizontal: 3

Box Shadow Vertical: 3

Box Shadow Blur: 3

Box Shadow Color: #d3d3d3
Enter the following details in Widget Internal Area Properties:
Internal Area Padding: 0px 0px
Enter the following details in Background Properties:
Panel Background Color: rgba(255,255,255,0)

Maximize Widget Background Color: rgba(255,255,255,0)

Widget Background Color: rgba(255,255,255,0)
Enter the following details in Title Properties:
Show Title: Disable
Click on Preview and Save and Exit.
Country: It displays the total count of countries.

From the right vertical menu select the Card Widget and update the card Properties, as below:
Name: Country

Dataset: Customer Order Details
Enter the following details in Card General Property
Select Columns: Country

Aggregation: Distinct Count
Enter the following details in Style Property
Padding: 12

Background Color: rgba(255,255,255,0)

Text color: #ffffff
Enter the following details in Formatting Property
Decimal Place: 0
Enter the following details in Title Property
Title: Country

Title Position: Top

Background Color: #bfbfbf

Title Font Weight: normal
Go to the Widget Setting and enter the following details in Widget Box Shadow Properties:
Box Shadow: Enable

Box Shadow Horizontal: 3

Box Shadow Vertical: 3

Box Shadow Blur: 3

Box Shadow Color: #d3d3d3
Enter the following details in Widget Icon Properties:
Hide Icon in Preview: Disable

Hide Maximize Icon: Enable

Hide Download Icon: Enable

Show Annotation Icon: Disable
Enter the following details in Widget Internal Area Properties:
Internal Area Padding: 0px 0px
Enter the following details in Background Properties:
Panel Background Color: rgba(255,255,255,0)

Maximize Widget Background Color: rgba(255,255,255,0)

Widget Background Color: rgba(255,255,255,0)
Enter the following details in Title Properties:
Show Title: Disable
Enter the following details in Filter Properties:
Show Filter Value: Enable
Click on Save and Exit.
Click on Ellipse icon ![]() of the Country KPI widget and select the copy option.
of the Country KPI widget and select the copy option.
It will display the dialog box as shown in the figure below, enter the following details in it:
Name: Total Product
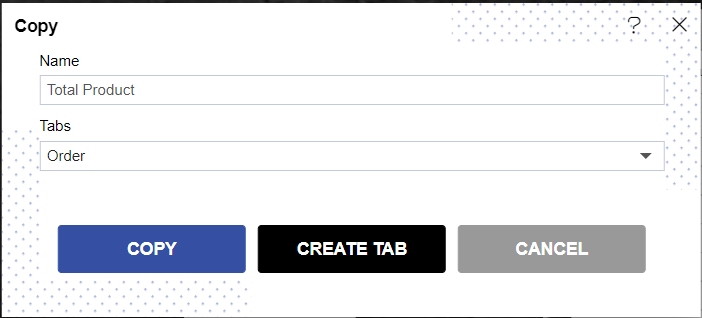
Click on the copy.
Total Product: It displays the total number of Products.

Enter the following details in Card General Property of the Total Product KPI widget.
Select Columns: Product Name

Aggregation: Distinct Count
Enter the following details in Title Property:
Title: Total Product
Click on Save and Exit.
Total Order: It displays the total number of Orders.
Copy the Country KPI widget and enter the following details in it.
Name: Total Order
Enter the following details in Card General Property of the Total Order KPI widget.
Select Columns: Order ID

Aggregation: Count
Enter the following details in Title Property:
Title: Total Order
Click on Save and Exit.
Total Customer: It displays the total number of Customers.

Copy the Country KPI widget and enter the following details in it.
Name: Total Customer
Enter the following details in Card General Property of the Total Customer KPI widget.
Select Columns: Customer Name

Aggregation: Distinct Count
Enter the following details in Title Property:
Title: Total Customer
Click on Save and Exit.
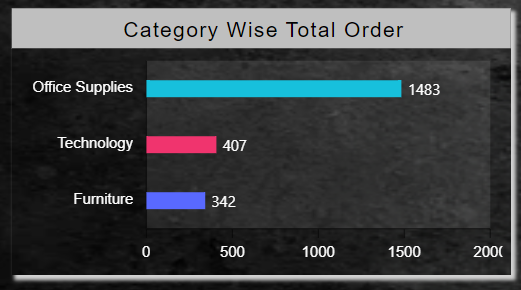
Category Wise Total Order: This Widget indicates the Total Order by Category.
From the Right vertical menu select the chart widget and enter the following details in the Clustered Bar Chart Property.
Name: Category Wise Total Order

Dataset: Customers Order Details.ds

Category Axis: Category

Value Column: Order ID

Aggregation: Count
Go to the Formatting property and enter the following details in General.
Color & Theme Property: Enable Color by Category

Color List: #5969ff,#f0346e,#17c0dc

Chart Sorting Based On Value >> Sort Type: Ascending

Chart Background Area >> Background Opacity: 0.1
Enter the following details in the Category Axis Property.
Category Labels >> ALignment: Trim

Category Font Property >> Color : #ffffff

Font Size: 12

Category Ticks: Disable
Enter the following details in the Value Axis Property.
Value Font Property >> Color : #ffffff

Font Size: 12
Enter the following details in Series Property.
Series General Properties >> Series Name: Category

Series Value Labels Position: Enable

Font Size: 12
Go to the Widget Setting and enter the following details in Widget Box Shadow Properties:
Box Shadow: Enable

Box Shadow Horizontal: 3

Box Shadow Vertical: 3

Box Shadow Blur: 3

Box Shadow Color: #d3d3d3
Enter the following details in Widget Icon Properties:
Hide Icon in Preview: Disable

Hide Maximize Icon: Enable

Hide Download Icon: Enable

Show Annotation Icon: Disable
Enter the following details in Background Properties:
Panel Background Color: rgba(255,255,255,0)

Maximize Widget Background Color: rgba(255,255,255,0)

Widget Background Color: rgba(255,255,255,0)
Enter the following details in Title Properties:
Title Move To: Center

Title Font Size: 17

Title Background Color: #bfbfbf

Padding: 8px 4px 4px 8px
Enter the following details in Filter Properties:
Show Filter Value: Enable
Click on Save and Exit.
Total Order by Year: This Widget indicates the Year-wise Total Order.
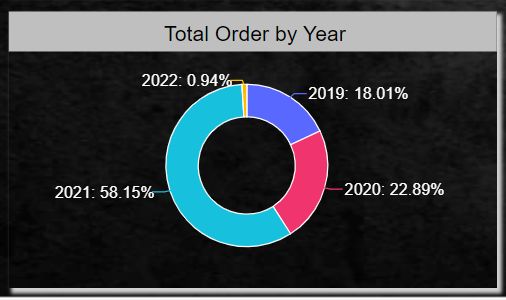
From the Right vertical menu select the chart widget and enter the following details in the Donut Chart Property.
Name: Total Order by Year

Dataset: Customers Order Details.ds

Category Axis: Ship Date

Value Column: Order ID

Aggregation: Count
Click on Grouping & Sorting ![]() icon of Category Axis and enter the following details in it.
icon of Category Axis and enter the following details in it.
Grouping: Enable

Column Name: Ship Date

Type: DateTime

Group By: Year

Sort Type: Ascending

Sort By Column: Ship Date
Click on Save.
Go to the Formatting property and enter the following details in General.
Color & Theme Property >> Color List: #5969ff,#f0346e,#17c0dc,#ffbb00,#7cbb00,#00a1f1,#f65314

Global Thousand and Decimal Separator: Enable Thousand Separator
Enter the following details in Series Property.
Series General Properties >> Series Name: Year

Series Ticks >> Enable Inherit Property from Series

Series Labels >> Color: #ffffff

Font Size: 13
Go to the Widget Setting and enter the details same as (follow the Widget setting property of Category Wise Total Order chart)
Click on Save and Exit.
Order by Delivery Place: This widget gives information about the Order by Delivery Location.
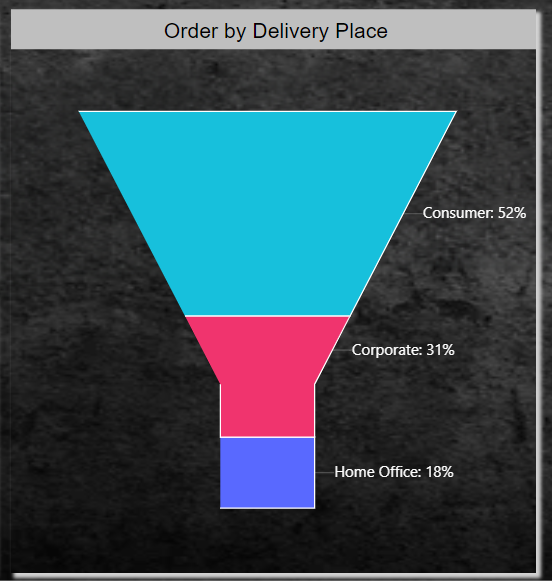
From the Right vertical menu select the chart widget and enter the following details in the Funnel Chart Property.
Name: Order by Delivery Place

Dataset: Customers Order Details.ds

Category Axis: Segment

Value Column: Order ID

Aggregation: Count
Go to the Formatting property and enter the following details in General.
Color & Theme Property >> Color List: #5969ff,#f0346e,#17c0dc,#ffbb00,#7cbb00,#00a1f1,#f65314

Global Thousand and Decimal Separator: Enable Thousand Separator
Enter the following details in Series Property.
Series General Properties >> Series Name: Order Delivered

Series Ticks >> Color: #ffffff

Length: 4

Series Labels >> Truncate: Enable
Go to the Widget Setting and enter the details same as (follow the Widget setting property of Category Wise Total Order chart)
Click on Save and Exit.
Order by Customer Name: It Displays information of Customer Order by Product Name.
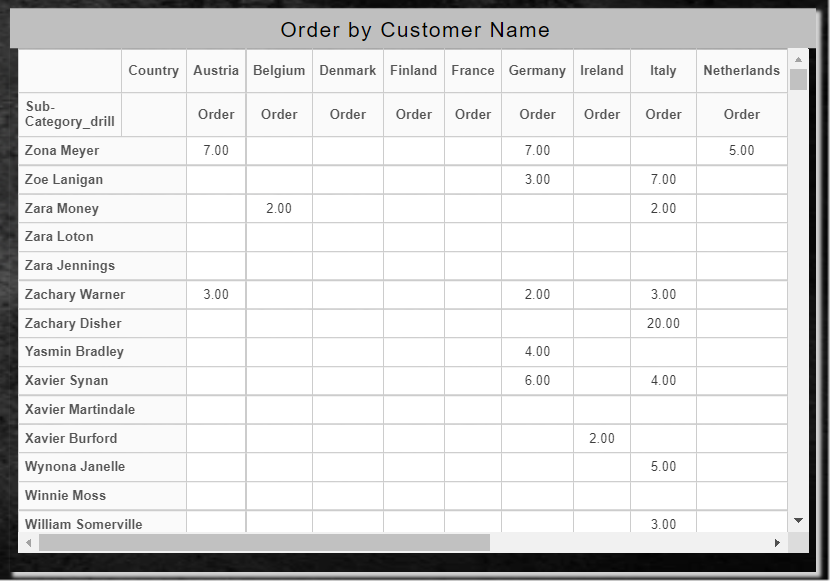
Name: Order by Customer Name
Dataset: Customers Order Details.ds
Enter the following details in Hierarchy Property:
Drag & Drop Sub Category and Customer Name And Click on Add Hierarchies.
Go to the Pivot Property and enter the following details into it.
Drag & Drop Sub Category_drill in Rows and Country in Column and Order in Values.
Go to the Widget Setting and enter the details same as (follow the Widget setting property of Category Wise Total Order chart)
Click on Save and Exit.
There are seven filters used in the Customer Order Service Dashboard.
Country Filter: It displays the list of the Country used in the Order Tab.

From the top right corner of the dashboard click on the filter Icon ![]() .
.
Click on + Icon ![]() to add filter and enter following details in it.
to add filter and enter following details in it.
Name: Country

Display name: Country

Event: On Change
Click on the Setting icon and enter the following details in the Filter widget.
Source: Dataset

Display Type: Multi-Select

Dataset: Customer Order Details.ds

Column_Name: Country

Show name in Widget: Disable
Enter the following details in the Link Filter and widget Property.
Layer: Layer1

Tab: Order

Widgets: (Select all the widgets one by one and link the Country column with all the widgets)
Go to the Filters Property and add Product Filter.
Product: It displays a list of the Product's Name.
Name: Product

Display name: Product

Event: On Change
Click on the Setting icon and enter the following details in the Filter widget.
Source: Dataset

Display Type: Multi-Select

Dataset: Customer Order Details.ds

Column_Name: Product Name

Show name in Widget: Disable
Enter the following details in the Link Filter and widget Property.
Layer: Layer1

Tab: Order

Widgets: (Select all the widgets one by one and link the Product Name column with all the widgets)
Go to the Filters Property and add Customer Filter.
Customer: It displays a list of the Product's Name.
Name: Customer Name

Display name: Product

Event: On Change
Click on the Setting icon and enter the following details in the Filter widget.
Source: Dataset

Display Type: Multi-Select

Dataset: Customer Order Details.ds

Column_Name: Customer Name

Show name in Widget: Disable
Enter the following details in the Link Filter and widget Property.
Layer: Layer1

Tab: Order

Widgets: (Select all the widgets one by one and link the Customer Name column with all the widgets)
Go to the Filters Property and add Service Type Filter.
Service Type: It displays Types of delivery Services.
Name: Service Type

Display name: Service Type

Event: On Change
Click on the Setting icon and enter the following details in the Filter widget.
Source: Dataset

Display Type: Multi-Select

Dataset: Customer Order Details.ds

Column_Name: Ship Mode

Show name in Widget: Disable
Enter the following details in the Link Filter and widget Property.
Layer: Layer1

Tab: Order

Widgets: (Select all the widgets one by one and link the Ship Mode column with all the widgets)
Go to the Filters Property and add Category Filter.
Category: It displays a list of Categories.
Name: Category

Display name: Category

Event: On Change
Click on the Setting icon and enter the following details in the Filter widget.
Source: Dataset

Display Type: Multi-Select

Dataset: Customer Order Details.ds

Column_Name: Category

Show name in Widget: Disable
Enter the following details in the Link Filter and widget Property.
Layer: Layer1

Tab: Order

Widgets: (Select all the widgets one by one and link the Category column with all the widgets)
Go to the Filters Property and add Order Date Filter.
Order Date: It displays the Product Order Date.
Name: Order Date

Display name: Order Date

Event: On Change
Click on the Setting icon and enter the following details in the Filter widget.
Source: Dataset

Display Type: Multi-Select

Dataset: Customer Order Details.ds

Column_Name: Order Date

Show name in Widget: Disable
Enter the following details in the Link Filter and widget Property.
Layer: Layer1

Tab: Order

Widgets: (Select all the widgets one by one and link the Order Date column with all the widgets)
Go to the Filters Property and add Ship Date Filter.
Ship Date: It displays the Product Shipping Date.

Name: Order Date

Display name: Ship Date

Event: On Change
Click on the Setting icon and enter the following details in the Filter widget.
Source: Dataset

Display Type: Multi-Select

Dataset: Customer Order Details.ds

Column_Name: Ship Date

Show name in Widget: Disable
Enter the following details in the Link Filter and widget Property.
Layer: Layer1

Tab: Order

Widgets: (Select all the widgets one by one and link the Ship Date column with all the widgets)
Go to the filter View Property and Click on the + icon of Country, Service Type, Product, Customer, Category, Order Date, and Ship Date filter to add a filter in the Order Tab of the dashboard.
Click on Save and Exit.
Sales Tab:
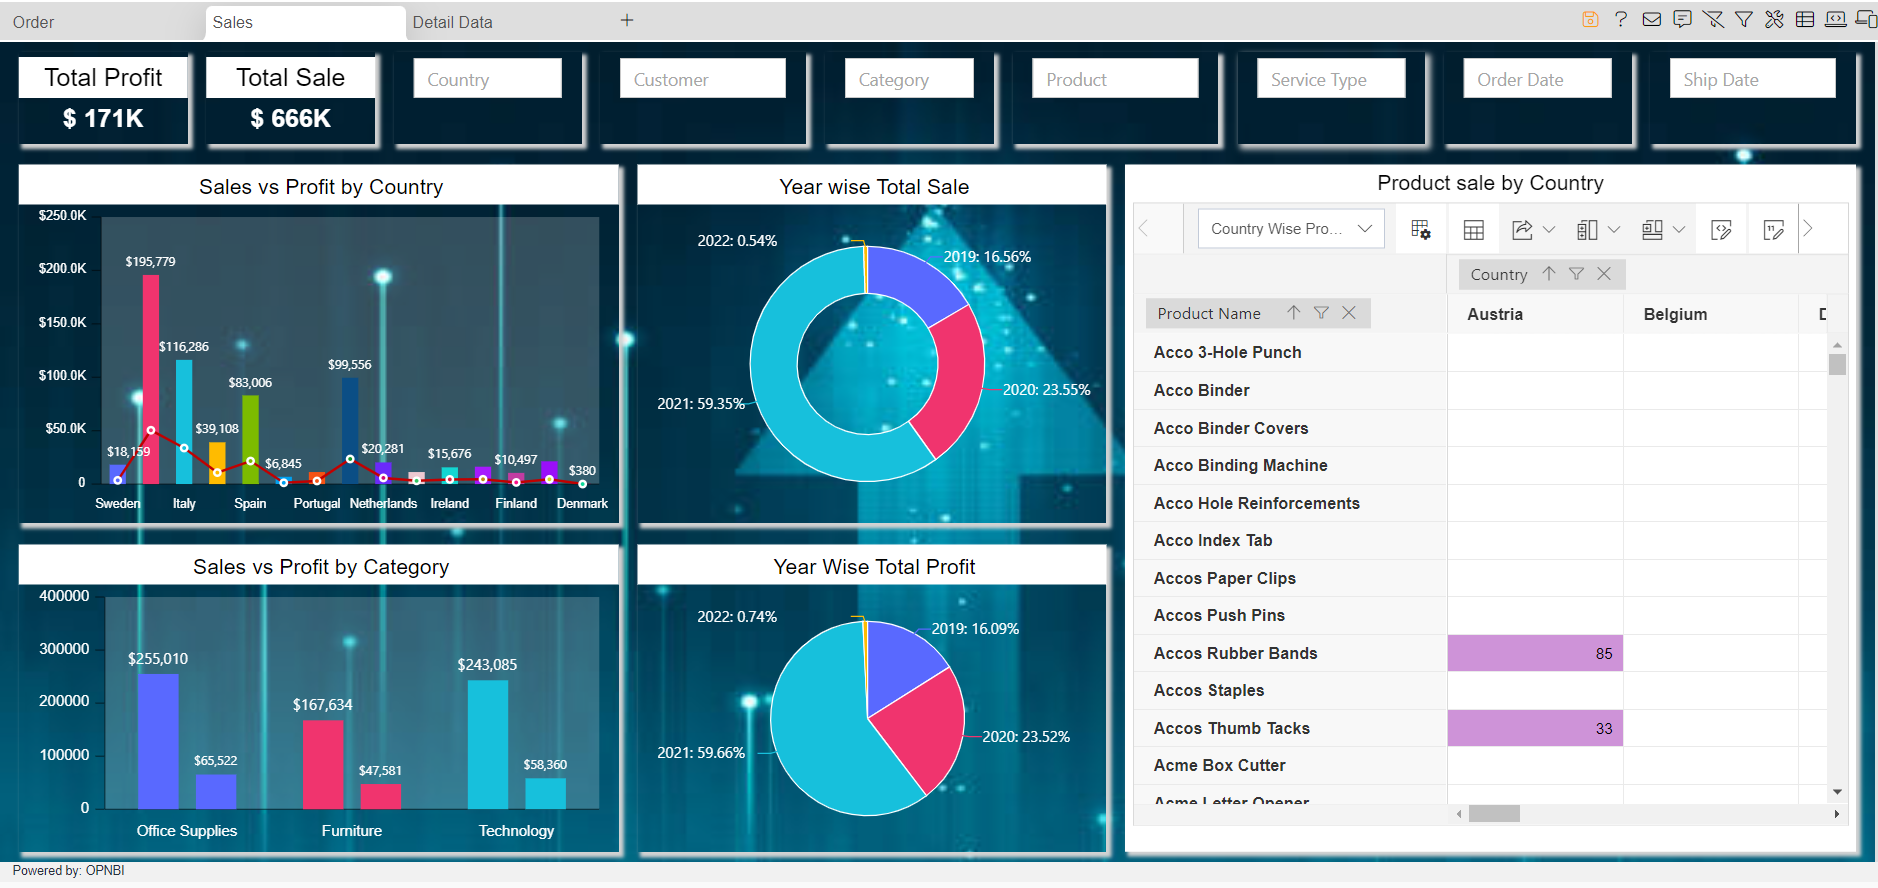
Total Profit: It displays the total count of the Country.

From the right vertical menu select the Card Widget and update the card Properties, as below:
Name: Total Profit

Dataset: Customer Order Details
Enter the following details in Card General Property
Select Columns: Profit

Aggregation: Sum
Enter the following details in Style Property
Padding: 12

Background Color: rgba(255,255,255,0)

Text color: #ffffff
Enter the following details in Formatting Property
Prefix: $

Abbreviation: Enable

Decimal Place: 0
Enter the following details in Title Property
Title: Total Profit

Title Position: Top

Background Color: #bfbfbf

Title Font Weight: normal
Go to the Widget Setting and enter the following details in Widget Box Shadow Properties:
Box Shadow: Enable

Box Shadow Horizontal: 3

Box Shadow Vertical: 3

Box Shadow Blur: 3

Box Shadow Color: #d3d3d3
Enter the following details in Widget Icon Properties:
Hide Icon in Preview: Disable

Hide Maximize Icon: Enable

Hide Download Icon: Enable

Show Annotation Icon: Disable
Enter the following details in Widget Internal Area Properties:
Internal Area Padding: 0px 0px
Enter the following details in Background Properties:
Panel Background Color: rgba(255,255,255,0)

Maximize Widget Background Color: rgba(255,255,255,0)

Widget Background Color: rgba(255,255,255,0)
Enter the following details in Title Properties:
Show Title: Disable
Enter the following details in Filter Properties:
Show Filter Value: Enable
Click on Save and Exit.
Total Sale: It displays the total count of the Country.

Copy the Total Profit KPI widget and enter the following details in it.
Name: Total Sale
Enter the following details in Card General Property of the Total Sale KPI widget.
Select Columns: Sale

Aggregation: Sum
Enter the following details in Title Property:
Title: Total Sale
Click on Save and Exit.
Sales vs Profit by Country: It displays the total sales and Profit of the Country.
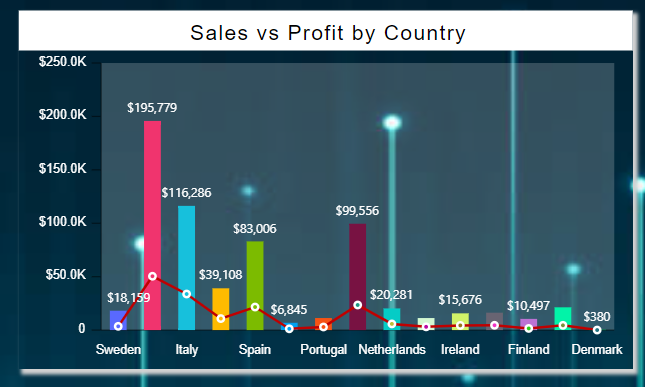
From the Right vertical menu select the chart widget and enter the following details in the Clustered Column Chart Property.
Name: Sales vs Profit by Country

Dataset: Customers Order Details.ds

Category Axis: Country

Value Column: Sales

Aggregation: Sum
Go to the Formatting property and enter the following details in General.
Color & Theme Property: Enable Color by Category

Color List: #5969ff,#f0346e,#17c0dc,#ffbb00,#7cbb00,#00a1f1,#f65314

Global Thousand and Decimal Separator >> Enable Thousand Separator

Chart Background Area >> Background Opacity: 0.2

Chart Tooltip >> Tooltip Text: ${series.name} ${point.x} : $${point.y}
Enter the following details in the Category Axis Property.
Category Font Property >> Color : #ffffff

Category Ticks: Disable
Enter the following details in the Value Axis Property.
Number Format: Enable

Abbreviation: Enable

Use Prefix from Abbreviation: Enable

Value Font Property >> Color : #ffffff
Enter the following details in Series Property.
Series General Properties >> Series Name: Sales

Series Value Labels Position: Enable

Text: <div>$${point.y}</div>

Font Color: #ffffff

Decimal Places: 0

Alignment: Hide
Enter the following details in the Trend Lines Property.
Click on the + icon to add Trendline.
Enter the following details in the General Property:
Value Column: Profit
Aggregation: Sum
Go to the Widget Setting and enter the following details in Widget Box Shadow Properties:
Box Shadow: Enable

Box Shadow Horizontal: 3

Box Shadow Vertical: 3

Box Shadow Blur: 3

Box Shadow Color: #d3d3d3
Enter the following details in Widget Icon Properties:
Hide Icon in Preview: Disable

Hide Maximize Icon: Enable

Hide Download Icon: Enable

Show Annotation Icon: Disable
Enter the following details in Background Properties:
Panel Background Color: rgba(255,255,255,0)

Maximize Widget Background Color: rgba(255,255,255,0)

Widget Background Color: rgba(255,255,255,0)
Enter the following details in Title Properties:
Title Move To: Center

Title Font Size: 17

Title Background Color: #bfbfbf

Padding: 8px 4px 4px 8px
Enter the following details in Filter Properties:
Show Filter Value: Enable
Click on Save and Exit.
Year-wise Total Sale: It displays the total sales by Year.
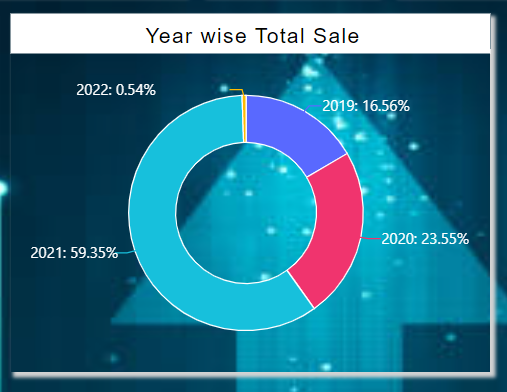
From the Right vertical menu select the chart widget and enter the following details in the Donut Chart Property.
Name: Total Order by Year

Dataset: Customers Order Details.ds

Category Axis: Ship Date

Value Column: Sales

Aggregation: Sum
Go to the Formatting property and enter the following details in General.
Color & Theme Property >> Color List: #5969ff,#f0346e,#17c0dc,#ffbb00,#7cbb00,#00a1f1,#f65314

Global Thousand and Decimal Separator: Enable Thousand Separator

Chart Tooltip >> Tooltip Text: ${series.name} ${point.x} : $${point.y}
Enter the following details in Series Property.
Series General Properties >> Series Name: Year

Series Ticks >> Enable Inherit Property from Series

Series Labels >> Color: #ffffff

Truncate: Enable

Font Size: 12
Go to the Widget Setting and enter the details same as (follow the Widget setting property of Sales vs Profit by Country chart)
Click on Save and Exit.
Sales vs Profit by Category: This widget gives information about the Category wise Total Sales and Profit.
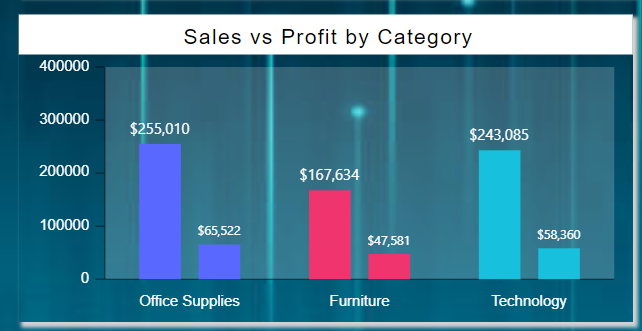
From the Right vertical menu select the chart widget and enter the following details in the Clustered Column Chart Property.
Name: Sales vs Profit by Category

Dataset: Customers Order Details.ds

Category Axis: Category

Value Column: Sales

Aggregation: Sum
Click on the + icon of Series to add a new Series2 and enter the following details in Series 2.
Value Column: Profit

Aggregation: Sum
Go to the Formatting property and enter the following details in General.
Color & Theme Property: Enable Color by Category

Color List: #5969ff,#f0346e,#17c0dc,#ffbb00,#7cbb00,#00a1f1,#f65314

Global Thousand and Decimal Separator >> Enable Thousand Separator

Chart Background Area >> Background Opacity: 0.2

Chart Tooltip >> Tooltip Text: ${series.name} ${point.x} : $${point.y}
Enter the following details in the Category Axis Property.
Category Font Property >> Color : #ffffff

Category Ticks: Disable
Enter the following details in the Value Axis Property.
Number Format: Enable

Abbreviation: Enable

Use Prefix from Abbreviation: Enable

Value Font Property >> Color : #ffffff
Enter the following details in Series Property.
Series1
Series General Properties >> Series Name: Sales

Series Value Labels Position: Enable

Text: <div>$${point.y}</div>

Font Color: #ffffff

Decimal Places: 0
Series2
Series General Properties >> Series Name: Profit

Series Value Labels Position: Enable

Text: <div>$${point.y}</div>

Font Color: #ffffff

Decimal Places: 0
Go to the Widget Setting and enter the details same as (follow the Widget setting property of Sales vs Profit by Country chart)
Click on Save and Exit.
Year Wise Total Profit: It Displays the total Profit by Year.
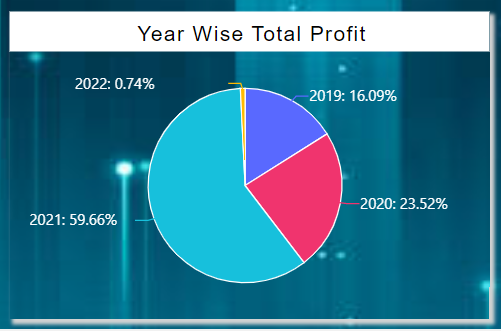
From the Right vertical menu select the chart widget and enter the following details in the Pie Chart Property.
Name: Year Wise Total Profit

Dataset: Customers Order Details.ds

Category Axis: Ship Date

Value Column: Profit

Aggregation: Sum
Click on Grouping & Sorting ![]() icon of Category Axis and enter the following details in it.
icon of Category Axis and enter the following details in it.
Grouping: Enable

Column Name: Ship Date

Type: DateTime

Group By: Year

Sort Type: Ascending

Sort By Column: Ship Date
Click on Save.
Go to the Formatting property and enter the following details in General.
Color & Theme Property >> Color List: #5969ff,#f0346e,#17c0dc,#ffbb00,#7cbb00,#00a1f1,#f65314

Global Thousand and Decimal Separator: Enable Thousand Separator

Chart Tooltip >> Tooltip Text: ${series.name} ${point.x} : $${point.y}
Enter the following details in Series Property.
Series General Properties >> Series Name: Year

Series Ticks >> Enable Inherit Property from Series

Series Labels >> Color: #ffffff

Truncate: Enable

Font Size: 12
Go to the Widget Setting and enter the details same as (follow the Widget setting property of Sales vs Profit by Country chart)
Click on Save and Exit.
Product Sale by Country:
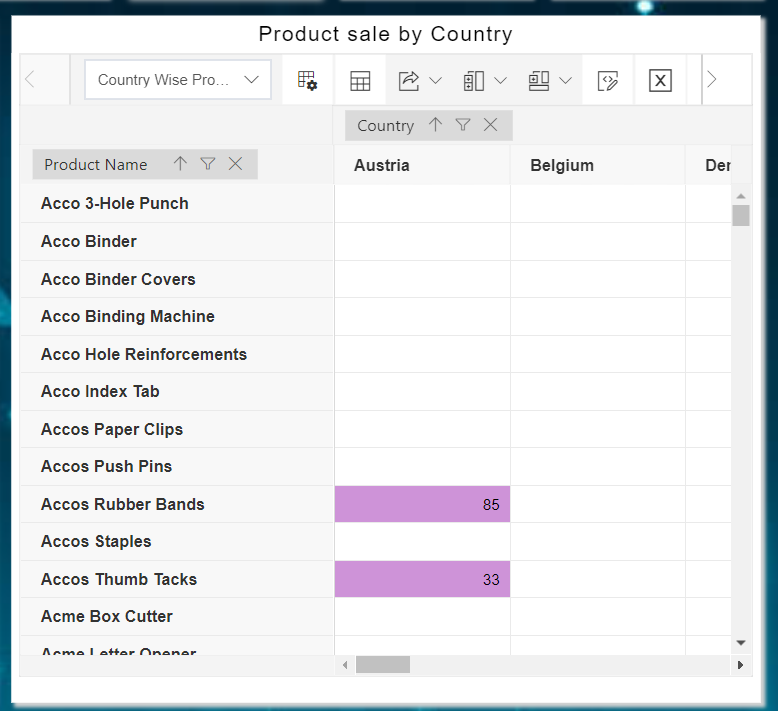
From the Right vertical menu select the Analysis widget.
Click on Show Fieldlist ![]() icon and enter the following details in it.
icon and enter the following details in it.
Drag & Drop Product Name in Rows, Country in Column, and Sales (Sum) in Values.
Click on Preview and Save and Exit.
Click on Conditional Formatting ![]() icon and enter the following details in it.
icon and enter the following details in it.
Click on Add Condition button and enter the following details.
Value: All Values, Greater Than Or Equal To, 300

Format: Select #90caf9 (blue Color)

Add Another Condition and enter the following details in it.

Value: All Values, Less Than, 300

Format: Select #CE93D8 (purple Color)
Click on Apply.
Go to the Widget Setting and enter the details same as (follow the Widget setting property of Sales vs Profit by Country chart)
Click on Save and Exit.
Widgets: (Select all the widgets of Sales Tab one by one and link the Appropriate column with all the widgets)same column as Country, Service Type, Product, Customer, Category, Order Date, and Ship Date filter of Order Tab.
Tab: Sales
Go to the filter View Property and Click on the + icon of Country, Service Type, Product, Customer, Category, Order Date, and Ship Date filter to add a filter in the Order Tab of the dashboard.
Click on Save and Exit.
Detail Data Tab:
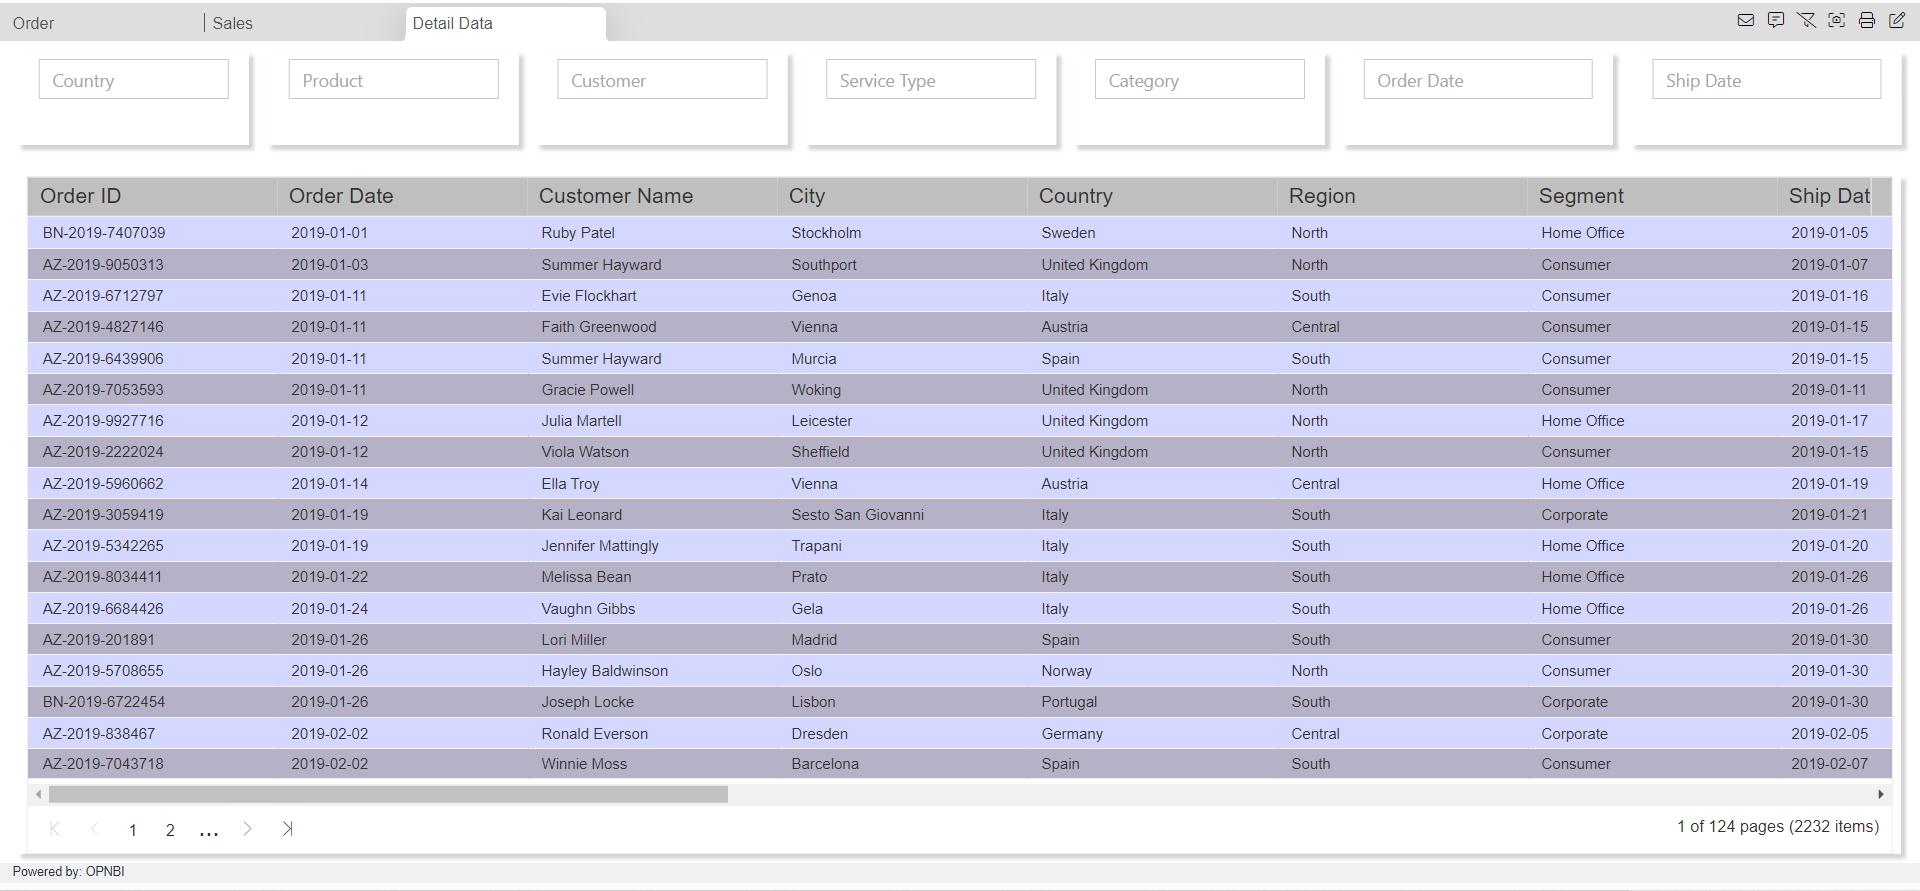
Detail Data Table: It displays all the detailed information about Customer Order Service.
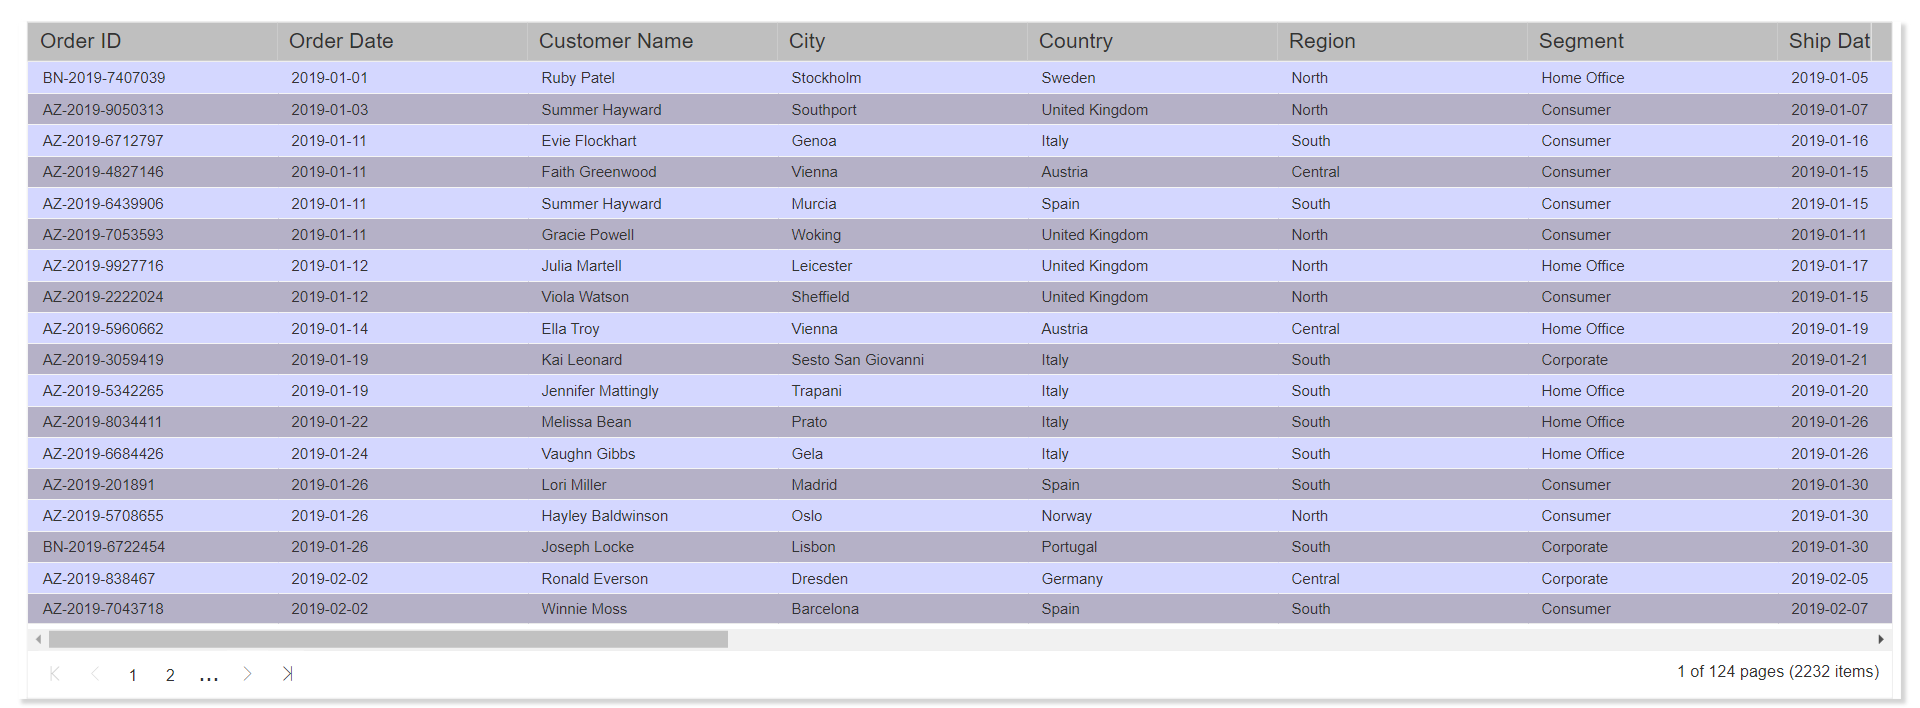
From the Right vertical menu select the Table Widget.
Name: Sales vs Profit by Category

Dataset: Customers Order Details.ds

In Dataset Column select all the fields.
Go to the Formatting property and enter the following details in Miscellaneous Properties.
Pagination: Enable

Pagination Size: 18
Go to the Theme property and enter the following details:
Table Header Properties >> Header Background Color: #bfbfbf

Header Font Size: 17

Table Body Properties >> Table Body Font Size: 12

Odd Row Background Color: #d4d7ff

Even Row Background Color: #b5b1c7
Go to the Widget Setting and enter the details same as (follow the Widget setting property of Sales vs Profit by Country chart)
Click on Save and Exit.
Widgets: (Select all the widgets of Detail Data Tab one by one and link the Appropriate column with all the widgets)same column as Country, Service Type, Product, Customer, Category, Order Date, and Ship Date filter of Order Tab.
Tab: Detail Data
Go to the filter View Property and Click on the + icon of Country, Service Type, Product, Customer, Category, Order Date, and Ship Date filter to add a filter in the Detail Data Tab of the dashboard.
Click on Save and Exit.